CLO Overview
Understanding CLOs
CLOs are structured credit instruments backed by a pool of debt that is securitized and managed as a fund. The pool of debt consist of senior secured bank loans made to businesses that are generally rated below investment grade. A CLO can be characterized by its purpose, collateral, turnover, vintage, and geographic exposure. Generally CLOs are classified as Arbitrage CLOs and Balance sheet CLOs.
- Arbitrage CLOs capture the excess spreads that exist between purchasing higher yield assets and issuing liabilities with a lower yield. They are actively managed, whereby a CLO manager initially selects and actively manages the portfolio over the life of each vehicle
- Balance sheet CLOs are used by financial institutions to securitize certain loans in order to remove them from balance sheet and to reduce regulatory capital requirements
CLOs came into existence in early 1980s in the US with a prime focus on reducing the balance sheet burden of banks and provide opportunity to investors to invest in bank loans. The first vintage of “modern” CLOs was issued starting in the mid-to-late 1990s. They included some loans and high yield bonds and were the standard CLO structure until the financial crisis struck in 2008. Similar to other fixed income markets, CLOs issuance dried up in the US after credit crisis of 2008-09.The rebound in US CLO market occurred in 2012 and has gained strength and wider acceptance ever since. The crisis resulted in strengthening of credit support and shortening the period in which repayment proceeds could be reinvested. The average annual volume of new issuance of US CLO from 2012 till 2017 is more than USD 91 billion, 88% higher than the average new issuance from 2002 till 2007. A survey conducted by Morgan Stanley1 in the third quarter of 2017 indicates that CLOs occupy the highest concentration of overweight positions among investors within asset-backed markets.
Basic CLO structure
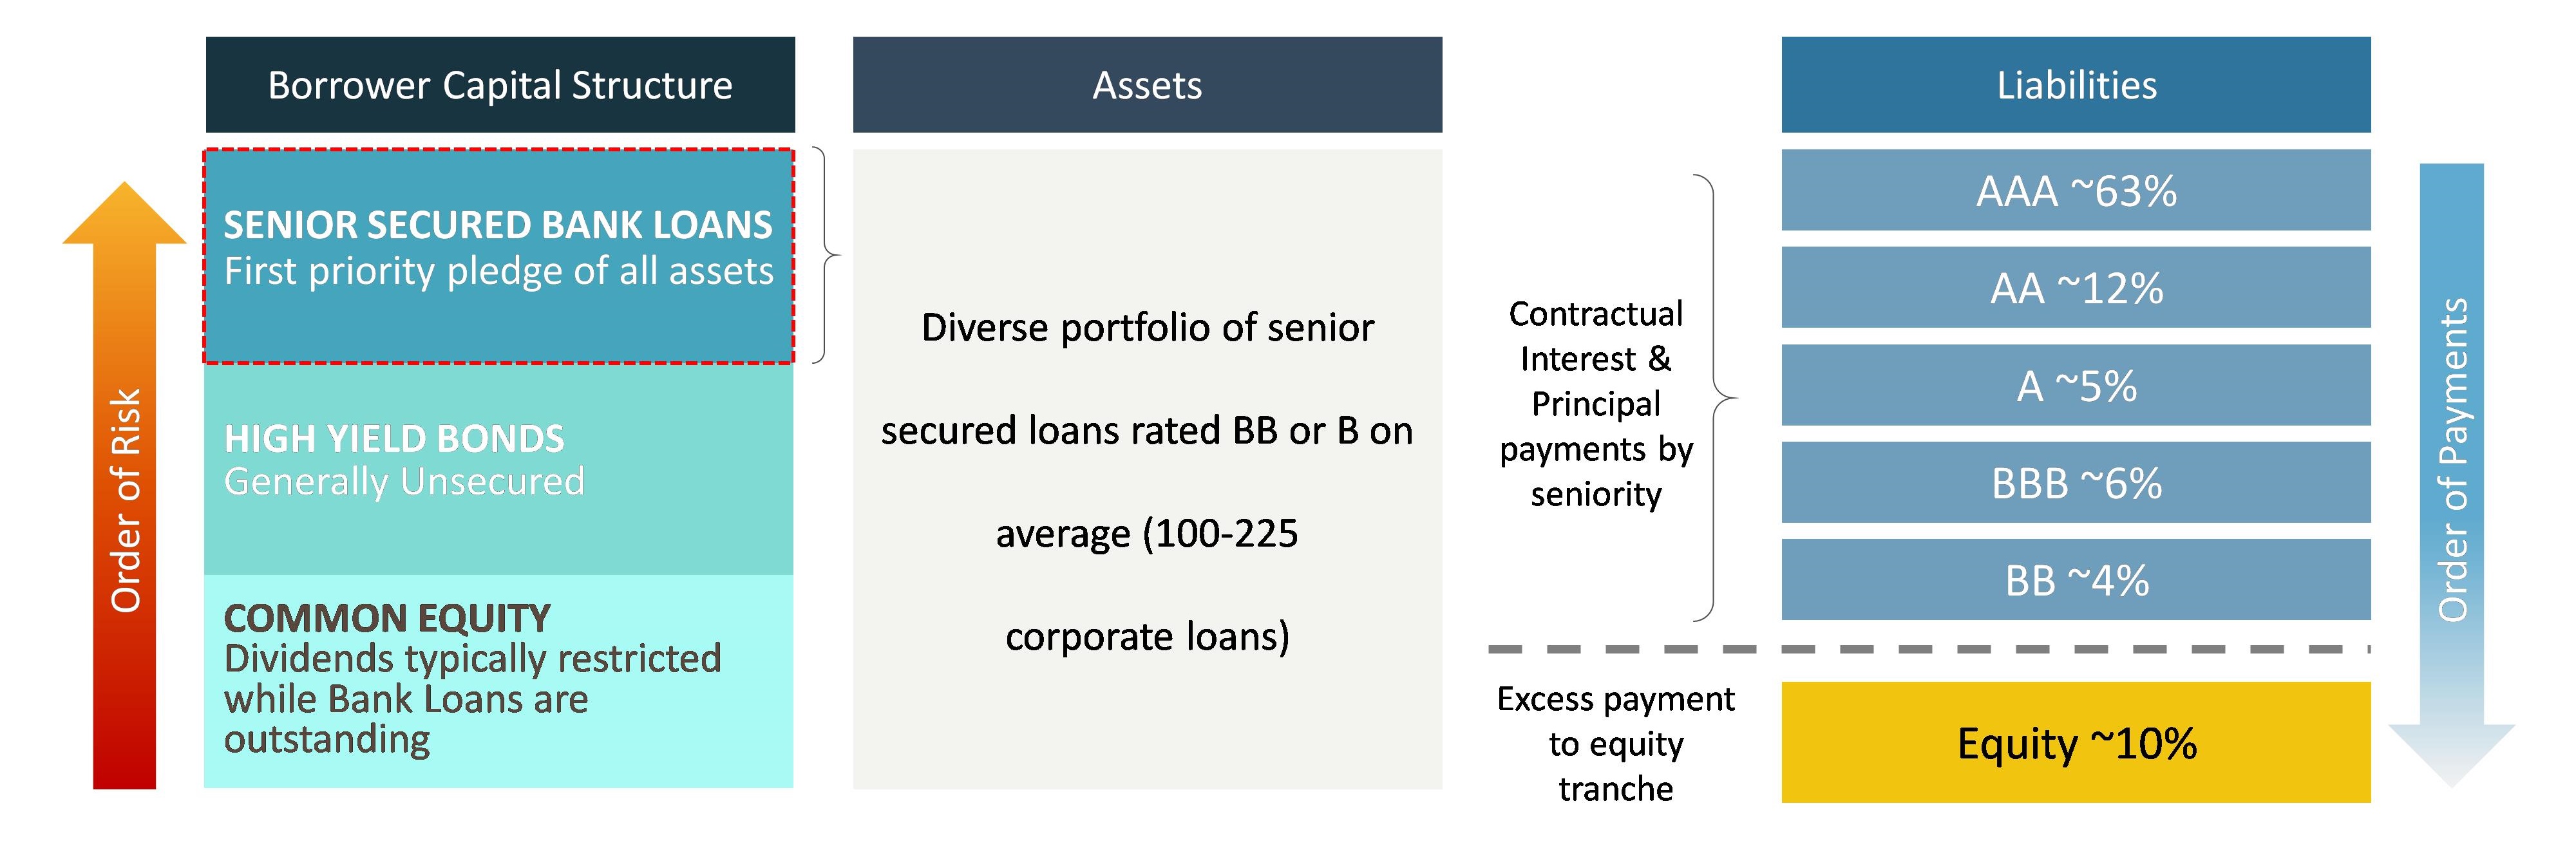
The CLO structure is made up of two parts: Collateral, which is also known as pool of assets, and tranches which forms liabilities.
The tranching mechanism is one of the important features where a specific order of seniority exists.
Each tranche is a piece of the CLO and represents the order of repayment.
It also dictates the risks associated with the investments.
These tranches are classified as debt tranche with different ratings along with the equity tranche or non-rated tranche.
Each tranche is protected from the loss by the tranches which are below that particular tranche.
Both risks and returns usually increases from the senior most tranche down to the equity tranche.
The equity tranche absorbs the first losses arising out of the total collateral and the senior most tranche is affected only after the tranches below it have borne the losses.
The highest tranche in the structure rated as AAA.
A typical CLO asset and liability structured is depicted in Diagram 1:
Diagram 1: CLO Structure (Illustrative purpose)
Source: Livermore representation
1 Morgan Stanley, Global Securitized Products Investors Survey Results, 3Q17, October 2017
CLO lifecycle
Each CLO has a defined lifecycle - from the purchase of the first asset to the repayment of all assets and tranches.
- Warehouse phase: At this stage, warehouse investors earn the carry (income from bank loans less the cost of financing) and CLO managers begin acquiring assets several months before the launch. Key features of the deal are determined at this stage and warehouse investors also typically gain the right to invest in the equity of the new CLO at economics not available in the secondary market.
- Pricing date: Arranger prices the notes by computing the issuance spreads and prices. Tranche terms such as prices and coupons are finalized. Pricing occurs 2 to 4 weeks before the closing date.
- Closing date: This is the date on which CLO transactions come into legal existence. Assets in the warehouse are transferred to SPV. Tranches are issued as investors pay and their interest starts to accrue.
- Ramp-up period: Managers do not acquire the full portfolio at the time of pricing. The manager purchases the remainder of the loans portfolio after the closing date when CLO is issued. In this phase, the portfolio of assets are fully ramped by the effective date.
- Effective date: It occurs after 3 to 6 months of closing date with rating agencies confirms their ratings.
- Non-Call Period: This period typically lasts 2 years. During this period equity holders cannot ask for liquidation of the portfolio or refinancing of the debt tranches. Investors can exercise their right to terminate a deal or reset or refinance the debt tranches after completion of non-call period.
- Reinvestment period: The CLO managers actively manages the loan portfolio during this period (typically for 4-5 years). Principal repayments and prepayments from the assets are used by collateral manager to purchase new assets.
- Amortization period: This period commences at the end of reinvestment period if the CLO is not called by the majority of the equity holders. During the amortization period, the manager uses the repayments from the assets to pay down outstanding CLO debt in order of seniority. This period lasts until the legal maturity of the deal or until the deal is called by a majority of equity investors.
Diagram 2: Key Participants of CLO
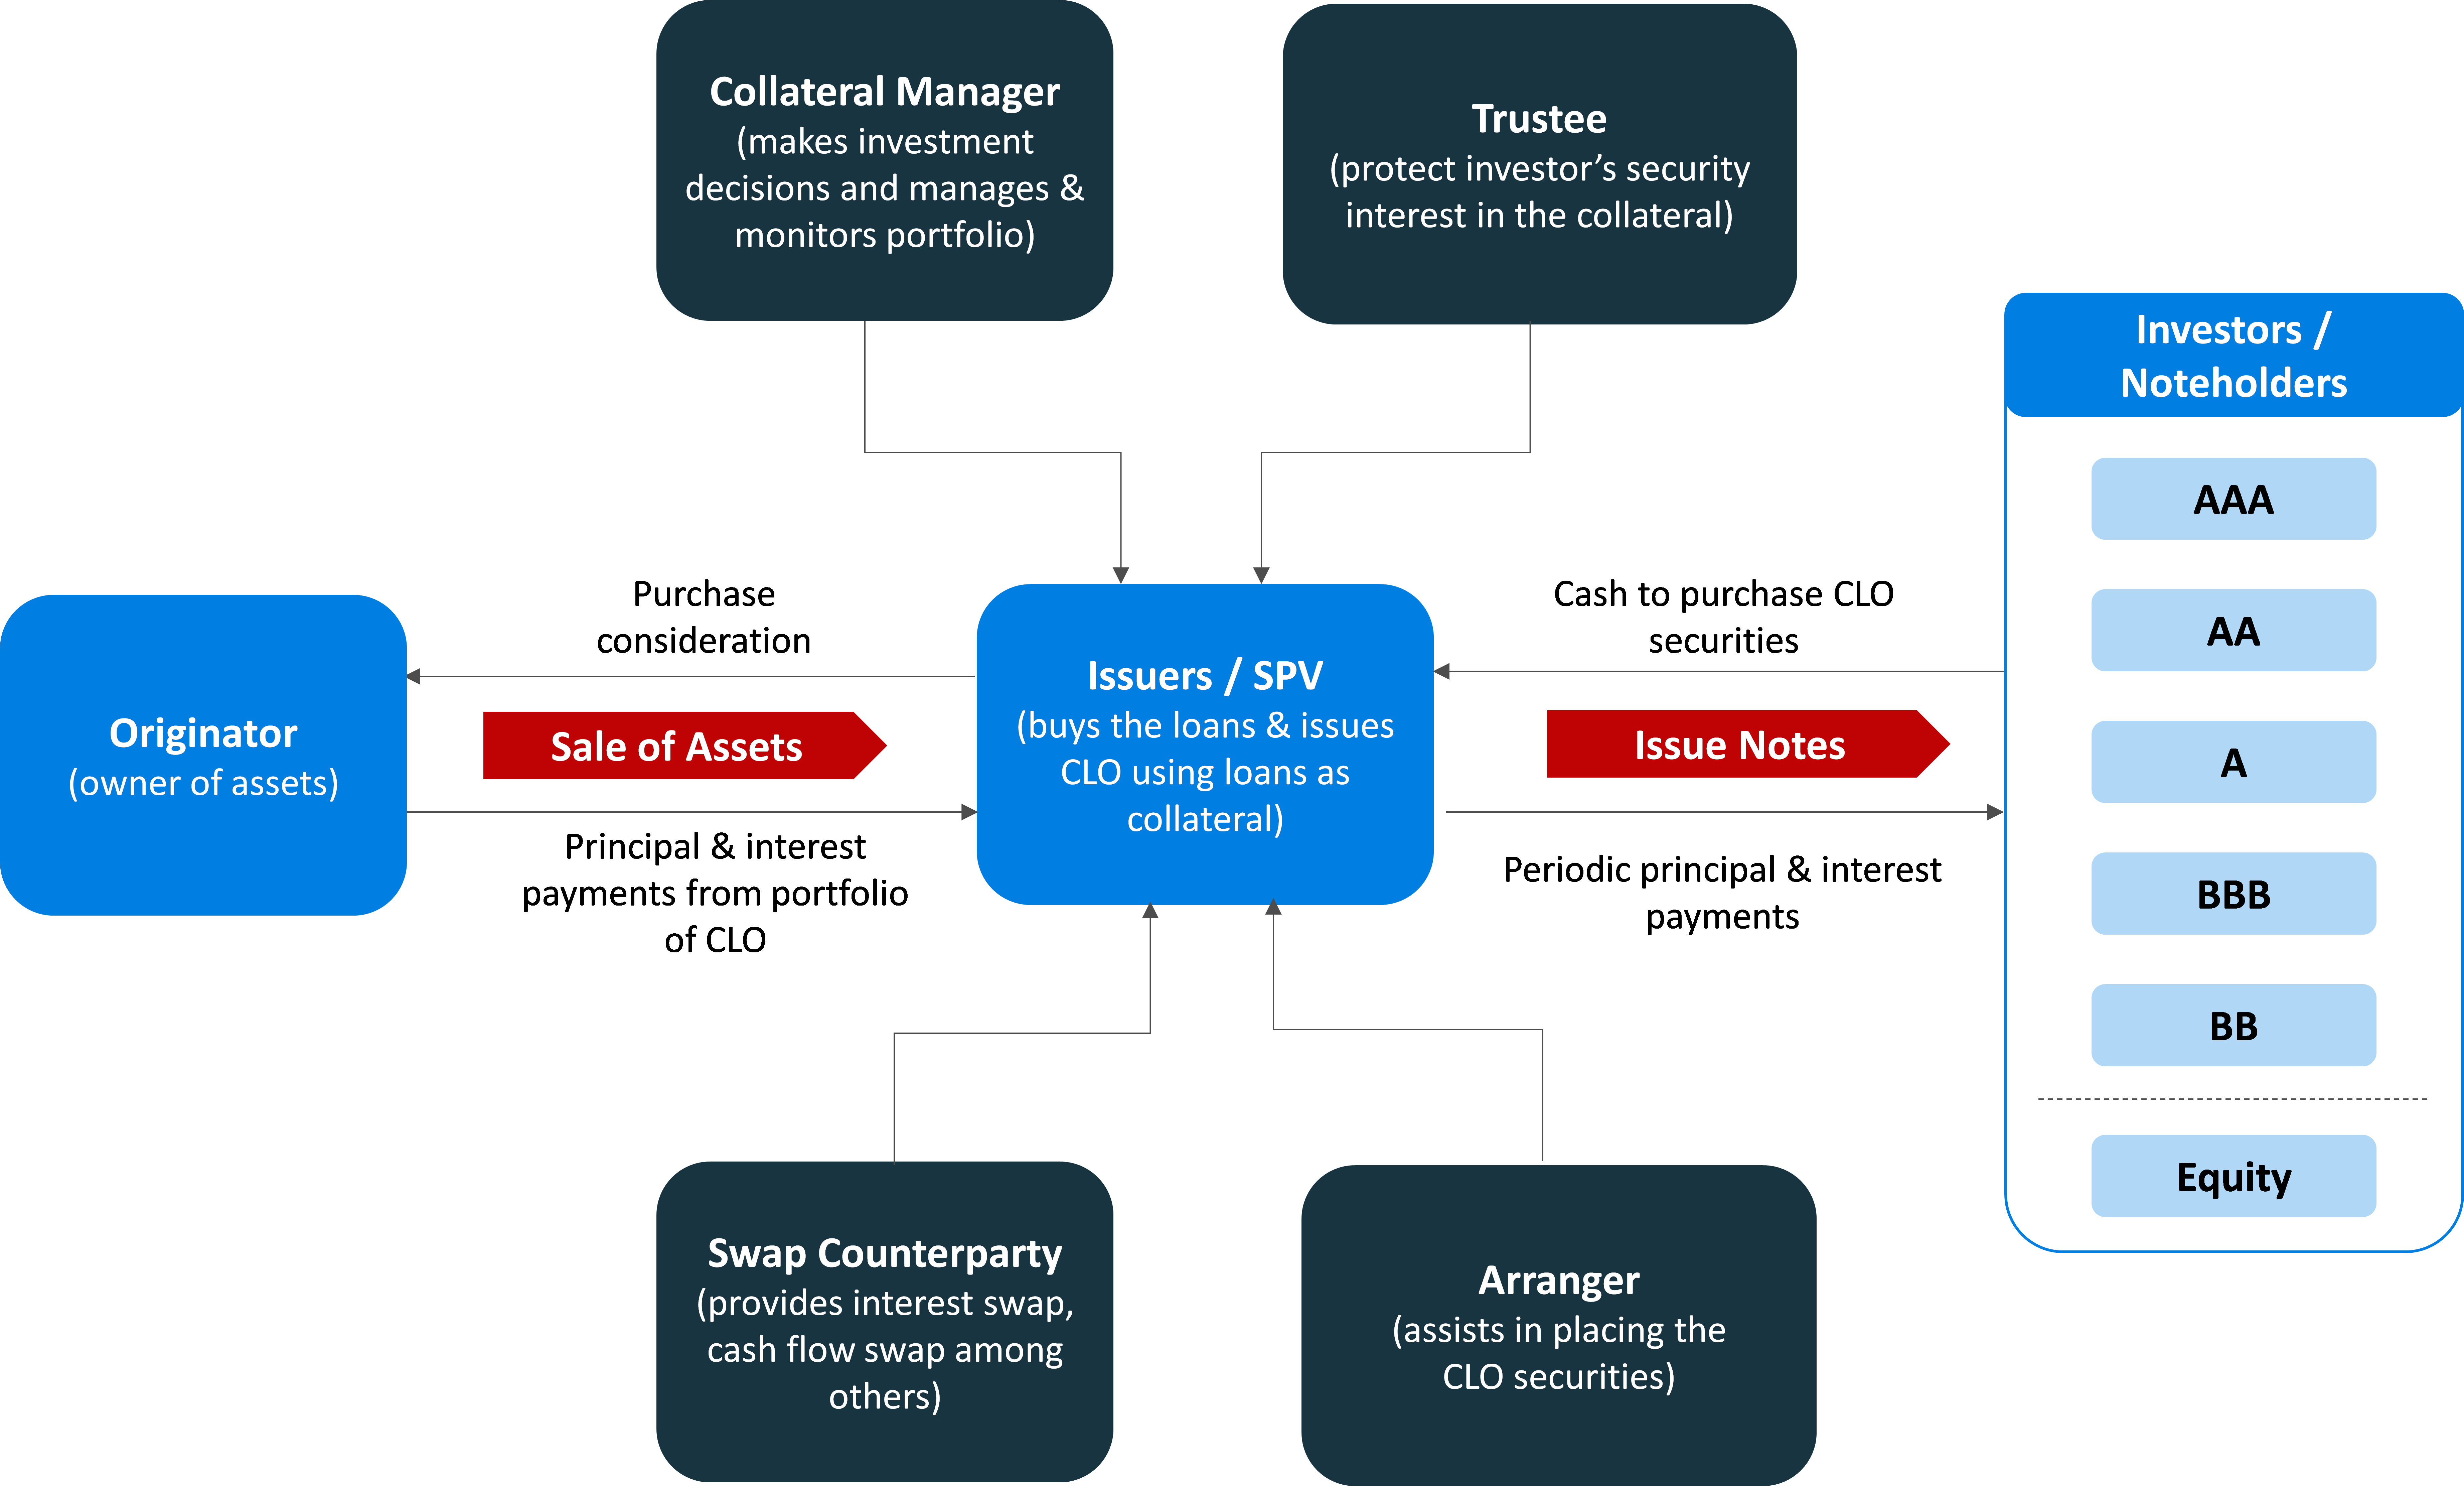
Source: Livermore representation
CLO characteristics
Focus on longer term financing: Unlike a typical finance company, the entirity of a CLO’s assets are loans, of which more than 90%-95% are senior secured or first lien. Since a CLO borrows for the long term, once the transaction closes, it does not have to borrow again and does no face forced liquidations due to unavailibity of financing in difficult market conditions. Long term investors like asset-managers, insurance companies and pension funds have also increased their allocation to CLOs. According to research by Citigroup, asset managers comprised 17.9% of the US AAA CLO market at the end of 2016, a significant increase from 4.4% in 2013.
Non-mark to market: CLOs are not subject to a mark-to-market triggers. They can actually take advantage of volatility during times of market distress. In an environment of spread widening, collateral managers can acquire cheaper assets with previously locked-in, non-recourse, non-mark-to-market financing. This creates additional opportunities to build par by purchasing collateral at a discount and through trading. A decline in Senior Secured Loan prices similar to 2008 and August 2011 did not impact CLOs directly, but provided CLOs an opportunity to acquire Senior Secured Loans at discounted prices.
Chart 1: Source: S&P/LSTA Index: Total Returns (%)
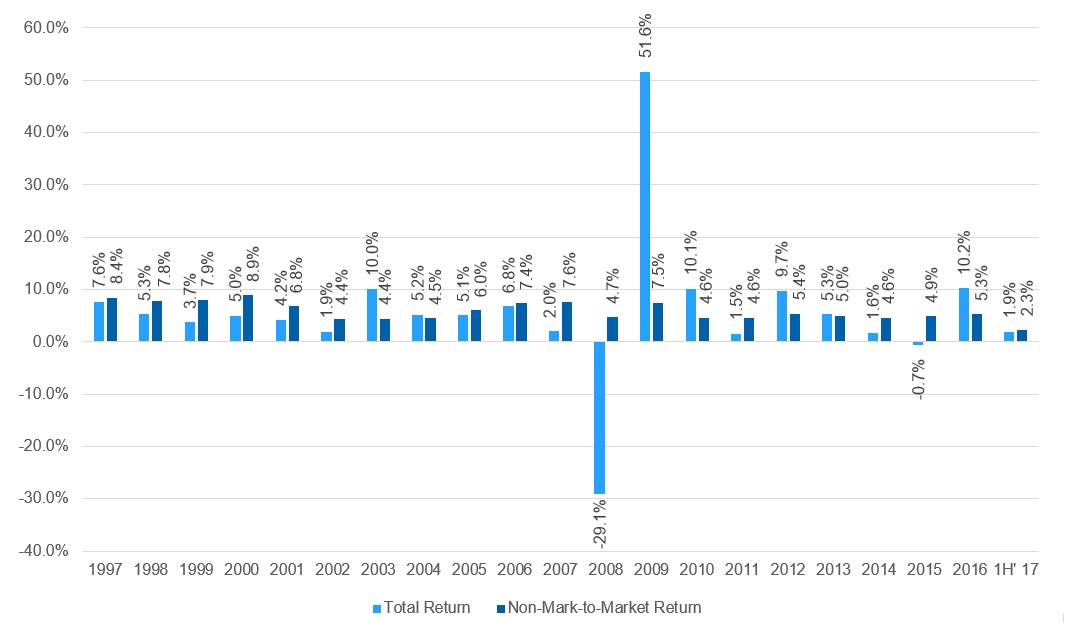
Source: S&P Capital IQ - LCD Research Commentary Charts. Past performance is no guarantee of future results
Diversification: Most private equity strategies tend to be very concentrated, whereas CLO equity provides much more diversified exposure. A CLO’s underlying collateral pool is subject to industry concentration limits, which minimize each CLO’s exposure to any one industry. In fact, the underlying CLO collateral pool typically consists of loans from 150–200 issuers, offering exposure to companies that span a wide variety of industries and sectors. S&P also found that CLO managers avoided potential losses amounting to just under 2% of US CLO 2.0 portfolios during the oil- and gas-related stress in Q4 2015 and Q1 2016.
Chart 2: Highly diversified portfolio across industry
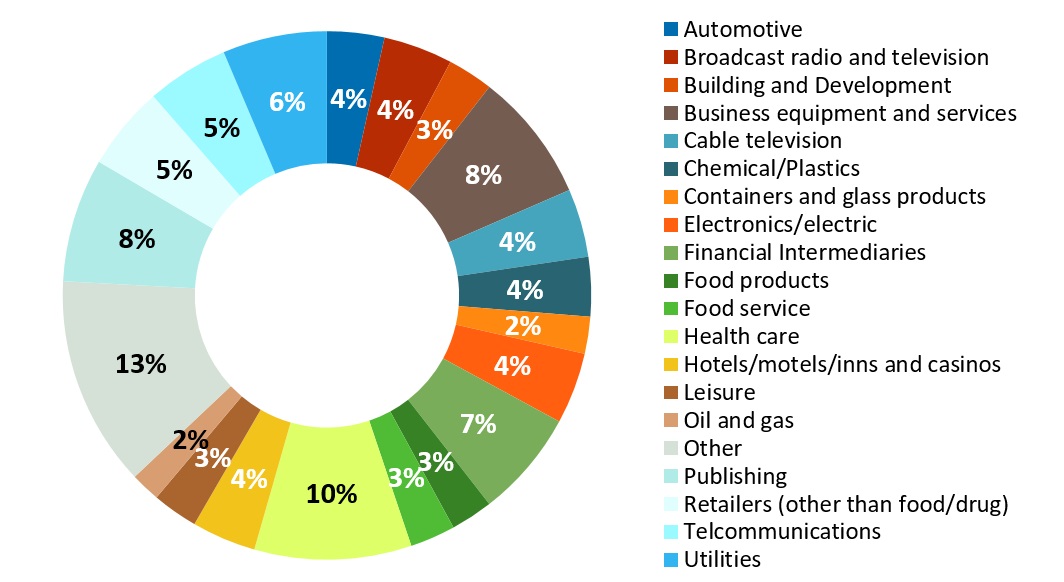
Source: Livermore Researh, A typical CLO portfolio
Active management: CLOs are actively managed vehicles; i.e., they have a reinvestment period during which the manager can reposition the portfolio within the parameters set forth by the governing documents. Managers add value by reinvesting and repositioning portfolios to increase returns and protect against downside risk during weaker economic times. In general, CLO managers have been able to add value by avoiding defaults and managing around portfolio constraints to keep the cash fully invested, thereby increasing the return on equity.
Moreover, research has shown that the overall credit performance in actively managed CLOs has outperformed static transactions, especially during periods of volatility. For example, S&P Global Market Intelligence showed that manager trades during the 2008–2009 credit crisis reduced potential losses by 10% on average4. Even though CLO managers tend to add value, the variability in their performance, especially during periods of distress, is significant. Selecting the right CLO manager could be a differntiating factor for clocking in higher returns and maintaining risk while investing in the similar vintage CLO.
Chart 3: Fitch-Rated CLO Index
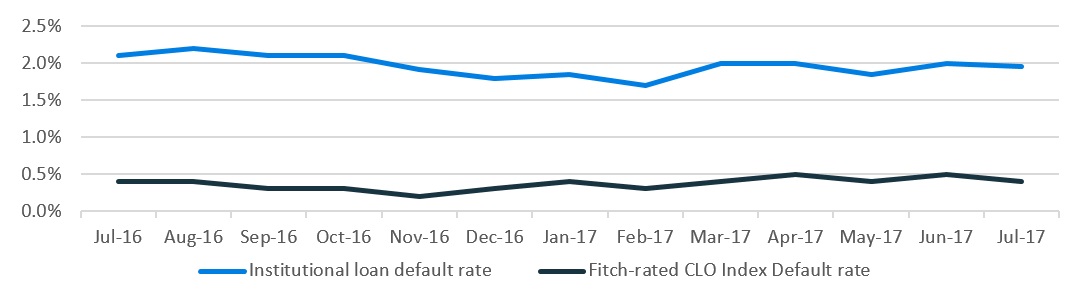
Source: Fitch US Leveraged Loan Default Insight, August 2017. Past performance is no guarantee of future results
4 S&P CLO Spotlight: How Do CLO Managers Perform in Times of Stress, September 6, 2016
Flexibility - Resets / Refi: A majority CLO equity investor has many rights related to repricing, refinancing, and calling the deal. As a result, they are less vulnerable to asset-liability mismatches and “run on the bank” scenarios. Based on market conditions, equity investors may be encouraged to refinance the debt tranches of the deal after the end of the non-call period to lower the cost of funding. In certain cases, they may make additional changes to the deal document such as extending the length of the reinvestment period. These flexibilties provide addional tools to the equity investor to further enhance its returns and minimize any potential market risks.
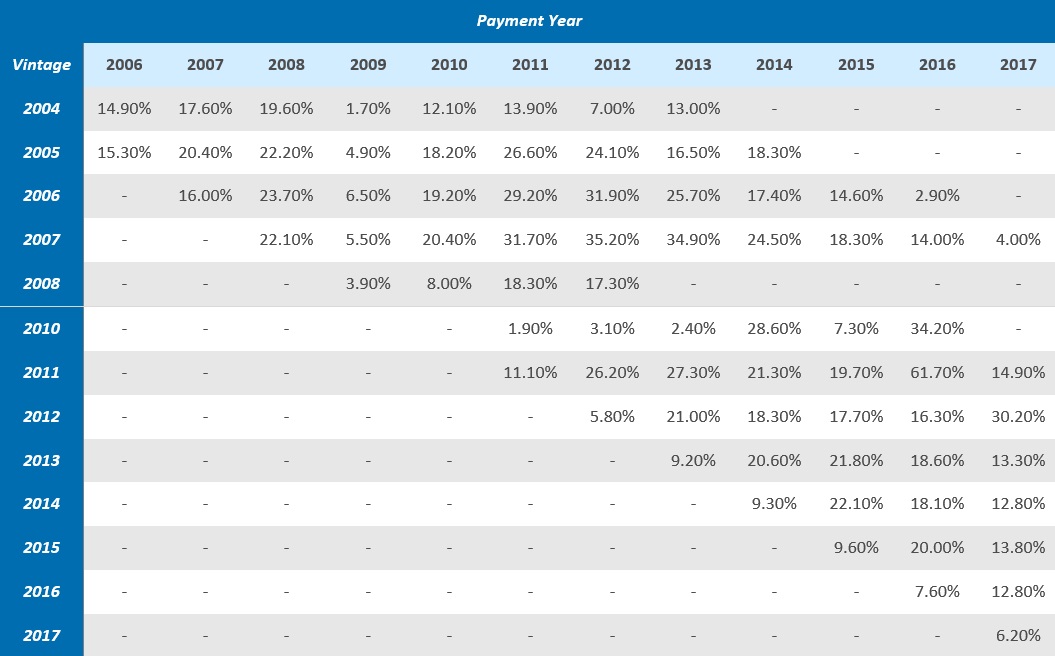
Table 1: Median US CLO Equity Distributions by Vintage
Source: Morgan Stanley Research, CLO Tracker February 2018
CLOs compared to commercial lender
SIMILARITIES
CLOs are similar to commercial lenders or banks in more ways than one. Both borrow money through deposits or investments and manages a loan portfolio. Business models are based on increasing the net interest margin, by borrowing cheap and lending at a higher margin. Both CLOs and commercial banks are levered on its equity. Prior to the 2008 – 09 crisis, banks reported common equity ratio of less than 5%, implying more than 20x leverage. CLOs on other hand are levered around 10x. Both are governed with certain guidelines and committees that overlook the management of these loan portfolios while protecting the interest of depositors and investors (ebt investors in the case of CLOs). Regulators monitor the bank and determine when to cut off dividends or what haircuts to apply on risky assets so that debt holders and depositors are protected from a complete wind down. Similarly in CLOs, such protections and terms are present and pre-defined in the CLO indenture and the trustee of the CLO implements them.
Similar to regulators monitoring banks, CLO managers publish a series of tests like overcollateralization, interest coverage and collateral quality tests among others on periodical basis to show quality of the loan assets to investors.
CLOs are essentially a traditional commercial bank without any baggage or exposure to complex derivative instruments which could hurt investors’ return.
DIFFERENCES
Apart from the key similarities discussed above, there are some key differences between CLO and commercial lender. Equity portion of CLO capital structure is locked and cannot be withdrawn during the term of the deal whereas for commercial bank, it can be withdrawn provided it is under the respective guidelines of Basel norms. As banks follow ‘fair value’ accounting, it is supposed to mark to market all their assets and liabilities during their quarterly statements, this could result in volatile changes in value if the credit market takes a hit during a period. CLO assets are held at par until realization or until impairment through a default, providing them an additional support during instability in the market. Banks are required to constantly monitor their asset-liability management (ALM), given its complexity of various deposit and credit products, whereas CLOs do no borrow short term and therefore do not face “bank run” type issues.
Banks have high and significant overhead costs and it could change with additional operating requirements, whereas CLOs operate on low operating costs and the amount is known in advance. CLOs provide monthly reports with exhaustive information on all its assets and their performance on individual loans and on a portfolio basis. Banks are not required to provide details on each of the assets but only on consolidated basis and are relatively less transparent. CLOs are governed by the indenture during the term of the deal and any change require investors’ consent.
Dividend distribution for banks are subject to regulatory and board approval, whereas for CLO all excess cash is distributed to equity investors unless certain pre-defined credit impairment thresholds are exceeded.
CLOs benefit over other Fixed Income instruments
CLOs offer investors multiple advantages, both on their own and in comparison to other fixed income products such as corporate and government bonds.
- Better returns: CLOs provide an opportunity to investors to earn excess return as compared to other fixed income securities and bonds over a period of time. Spread difference between average CLO spreads and comparable rated bonds is typically positive across different rating in IG and HY, wider as we move down the tranche.
- Diversified risk profile: CLO structure is made up of different tranches ranging from senior to equity, with risks varying as per the seniority of the tranches. Different CLO tranches have the potential to meet the needs of a wide range of investors such as pension fund and insurance.
- Managers incentives are aligned: Managers are paid senior and subordinated management fees. Subordinated fees is only paid if CLO is in good health. Further incentive fees are due if equity investors recevie more than a predetermined IRR.
- Floating rate and shorter duration: CLO liabilities are floating rate in nature which reduces interest rate sensitivity and results in shorter duration. LIBOR’s sensitivity to changing market interest rate ensures each of the tranche’s return are reflective of market returns. This reduces the overall cost of adjusting the portfolio to achieve the target returns of the investor.
- Low correlation to other Asset Classes: CLO correlations versus other fixed income categories are relatively low, meaning that CLOs can provide effective diversification in a broader portfolio. It is negatively corelated to US Treasury bonds and has low correlation to US investment grade corporate bonds and equities.
CLOs have historically experienced lower default rates, higher recovery rates, and lower credit volatility relative to high yield corporate bonds. According to S&P 2, AAA and AA-rated CLO tranches have never incurred a default (data back to 1994). Over this 23-year period, cumulative default rates further down the capital structure were 0.41% in US. A separate Moody’s study estimated the cumulative impairment rate for global CLOs for 1993-2009 of only 1.36% 3
Table 2: US CLO Historical Defaults: 1996 - 2017
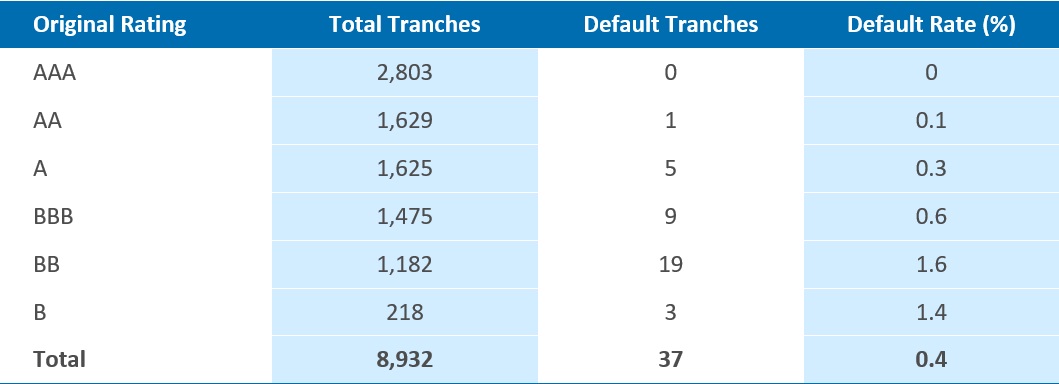
Source: S&P Global Fixed Income Research, data as of 09/30/17. Past performance is no guarantee of future results
2Fifteen Years Strong: A Look Back at European CLO Credit Performance, March 2016, Standard and Poor’s. Twenty Years Strong: A Look Back at US CLO Ratings Performance from 1994 through 2013, January 2014, Standard and Poor’s.
3Impairment and Loss Rates of US and European CLOs: 1993-2015. Material impairments – securities that have: i) sustained an interest shortfall or principal write-down/loss that has not been cured; ii) been downgraded to Ca or C, and hence is expected to suffer a significant level of payment losses in the future; or iii) been subject to a distressed exchange
CLO Control Equity – Favorable economics and cheap optionality
CLOs are bankruptcy-remote vehicles that issue equity and borrow funds (CLO liabilities) to invest in bank loans (CLO assets). CLOs receive interest income from bank loans and pay interest on CLO liabilities. The residual income after certain expenses is then paid to CLO equity. CLO liabilities offer long term, non-mark to market funding to CLOs. These characteristics allow CLOs to benefit from volatility and asset price dislocations in the bank loan market.
CLO equity generates a high cash-on-cash return with a target of generating a low-mid teens IRR after accounting for potential defaults on bank loans. New issue CLO equity provides for longer cash flows, cheap optionality embedded in the structure and a longer timeframe to benefit from the volatility in the bank loan market.
Anchoring the new issue transaction creates a strong negotiating position and helps capture best possible economics. Invaluable control rights provide ability to refinance and restructure the transaction as well as capture opportunities for investing in the debt tranches.
Most private equity strategies do not start realizing gains (or losses) on the underlying portfolio companies until after the capital drawdown and investment period, which typically lasts up to four years. On the other hand, CLO equity has a “front loaded” return profile, meaning that investors can expect cash flows right away.
CLO Equity performance
CLOs are important part of fixed income landscape because they offer investors an opportunity to invest in slices of the total collateral that could meet their particular risk and yield objectives. The equity tranche represents a claim on all excess cash flows once the obligations for each senior and mezzanine tranche have been met.
Though equity tranche bears the first loss arising out of default, CLO equity holders are given significant control over the length of the life of overall CLO structure and they are entitled to receive excess cash. Performance of CLO equity is driven by combination of market opportunities and managerial skill. While the debt investors enjoy structural protections from various tests like principal and interest over-collateralization ratios, credit quality, weighted average life and diversification, equity investors benefit from a stable funding structure with key attributes that are not achievable elsewhere – term, non-recourse and non-mark to market financing.
According to JP Morgan analyst, the overall market average returns for the past 14 years is 18.3%, with US CLO equity 2018 YTD returns were 7.4% outpacing the other fixed income assets class.
Risks associated to CLO
Investors in CLO tranches face several risks related to their investment. Exposure to these risks defines the risk/return profile of each investment. The main risks are described below.
|
Prepayment
Risk |
·
Borrowers
may choose to prepay their loans in advance. Due to such prepayments, cash
flows gets disrupted and future interest on that part of collateral will not
be paid ·
It
has its impact on reinvestment period also as newly purchased loans may not
yield as much interest as prepaid ones |
|
Credit Risk |
|
|
Managerial
Risk |
|
|
Liquidity
Risk |
|
|
Reinvestment
risk |
|
|
Chances of
collateral deterioration |
|
US CLO Market Update
2Q -2018 update
New CLO issuance
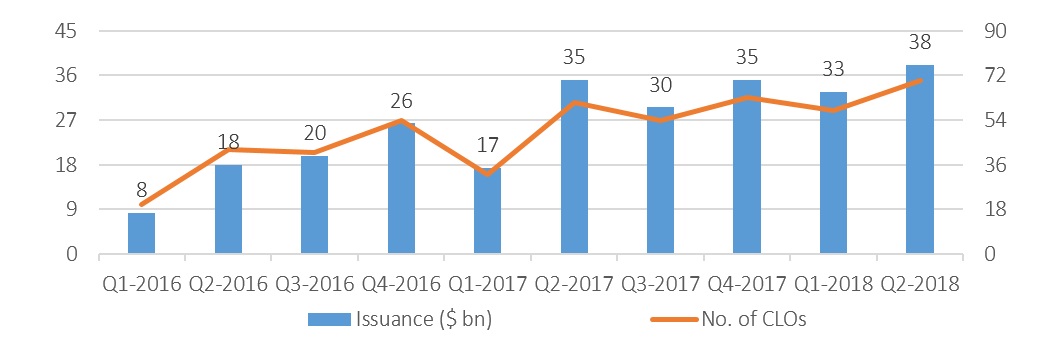
2018 had a busy start with CLOs picking up where they left off last year. The new issue volume nearly doubled in the first quarter of 2018 with a total issuance of USD 32.73 billion compared to USD 32.73 billion in Q1 of 2017 and continued to increase in the second quarter as well. The monthly CLO issuance was the largest of the year in June 2018 with 30 CLOs totaling USD 15.65 billion issued. In fact, the first six months of 2018 produced larger new CLO issuance volumes than the first six months of either 2017 or 2014 (witnessed the highest volume since 2008 financial crisis). The US CLO market is on track for a record year, as investors seek floating-rate products in a rising interest rate environment.
Chart 1: US CLO New Issuance
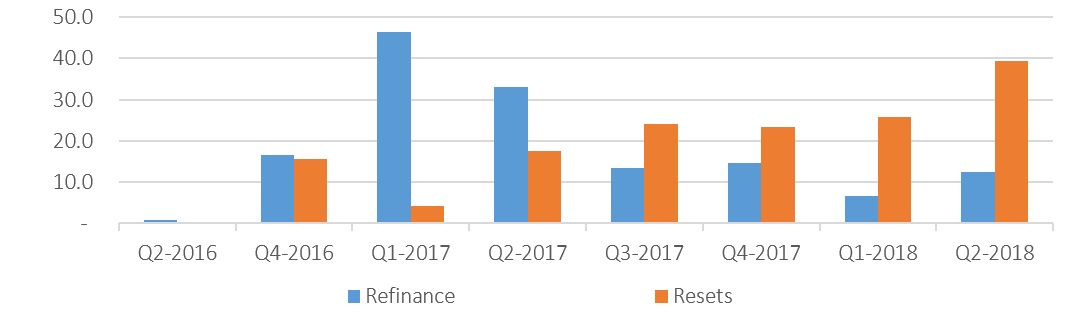
Refinancing and resets
CLO reset and refinancing activity outpaced new issue CLO volume during the first half of 2018 with USD 65.05 billion in resets/reissues and USD 19.03 billion in refinancing. CLO Resets (which reprice the debt on existing portfolios as well as extending the deal’s reinvestment period) have outpaced refinancing activity (which keeps fund’s maturity in place but decreases the spreads paid to the investors) over past 12 months. US CLO managers have been focusing more on CLO resets and looking to extend existing deals on the back of risk retention rules being vacated earlier this year. CLO managers are no longer required to hold a 5% piece of the deal issued including in resets of deals priced before the risk retention rule came into force in December 2016. This has made resets a more attractive option. The US CLO market is expected to continue to see a busy year due to strong demand for CLO debt and equity, many second half 2016 vintage CLOs coming off of non-call, and several earlier vintage CLOs looking to extend their reinvestment periods via resets.
Chart 2: US CLO Refinancing & Resets Issuance (USD billion)
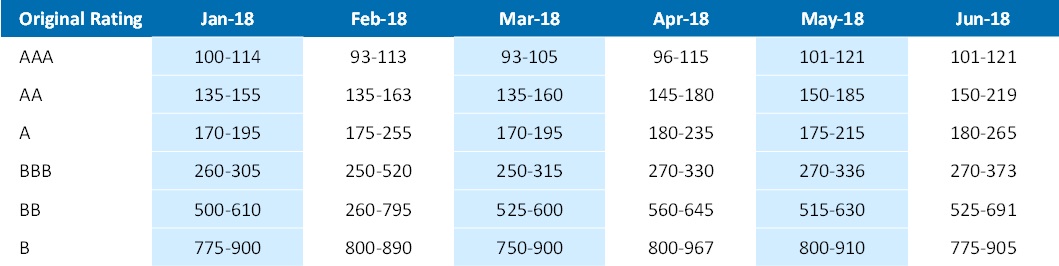
Changes in debt spreads
With strong demand for floating rate instruments and limited supply of new issue and reset and refinancing transactions prior to repeal of the Risk Retention regulations, debt spreads tightened over the initial months of 2018 with AAA rated tranche spreads over Libor ranging between 95-105bp. Since April 2018, however, spreads widened across investment grade tranches on the back of the increased supply.
Table 1: Average spreads of Broadly Syndicated US CLOs
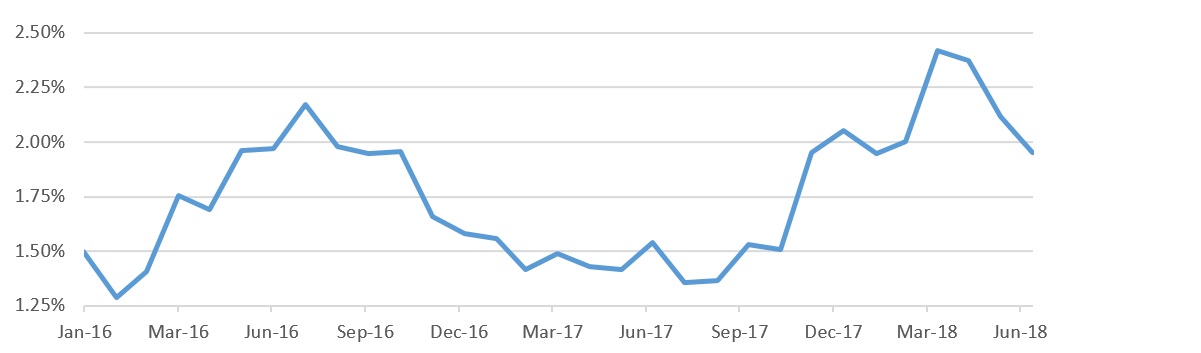
Default rates for leveraged loans
The 12-month trailing U.S. default rate by principal amount decreased in 2018 and currently stands at 1.95%. Leveraged loan defaults have remained low in the years since the financial crisis in 2008. The default environment peaked in 2009, when the institutional leveraged loan default rate reached 10.5%. According to a study by LCD, portfolio managers predict the one-year-forward default rate of the S&P/LSTA Index to hover around 2.46% by June 2019 mainly because of unusually long stretch of ongoing favorable credit cycle and loosely structured covenant-lite loans in the current market. Again it is hard to call the end of a credit cycle, as most signs point to a healthy US economy.
Chart 3: Leveraged Loan Default Rates
CLO
CLO offer investors multiple advantages
Our investments is a reflection of our values and course of action.
Balance, Potential, Value, Think Globally-Act Locally.